

Drawing bounding boxes for localization
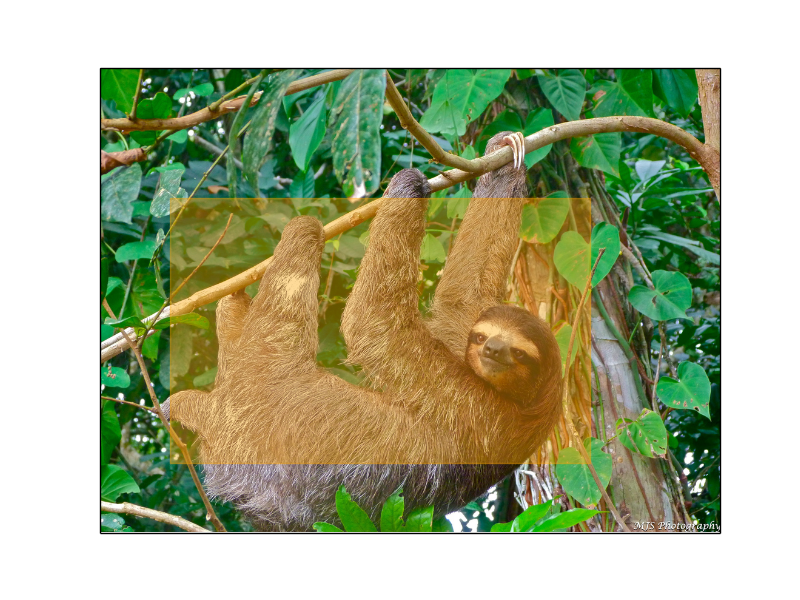
Drawing a bounding box on a detected object is crucial to properly finding objects in images. One very simple way to do this is by simply finding all points with a matching classification, then creating a box using the minimum and maximum values for X and Y of the matching points.
For more detail about how this works in detail, see the
plot_localization_tutorial example.
Python source code: plot_single_localization.py
print(__doc__)
import matplotlib.pyplot as plt
from matplotlib.patches import Rectangle
from sklearn_theano.datasets import load_sample_image
from sklearn_theano.feature_extraction import OverfeatLocalizer
from sklearn_theano.feature_extraction import get_all_overfeat_labels


def convert_points_to_box(points, color, alpha):
    upper_left_point = (points[:, 0].min(), points[:, 1].min())
    width = points[:, 0].max() - points[:, 0].min()
    height = points[:, 1].max() - points[:, 1].min()
    return Rectangle(upper_left_point, width, height, ec=color,
                     fc=color, alpha=alpha)

X = load_sample_image("sloth.jpg")
sloth_label = [label for label in get_all_overfeat_labels()
               if 'three-toed sloth' in label][0]
clf = OverfeatLocalizer(match_strings=[sloth_label])

sloth_points = clf.predict(X)[0]
sloth_box = convert_points_to_box(sloth_points, 'orange', .4)

plt.imshow(X)
ax = plt.gca()
ax.autoscale(enable=False)
ax.add_patch(sloth_box)
ax.get_xaxis().set_ticks([])
ax.get_yaxis().set_ticks([])
plt.show()
Total running time of the example: 212.29 seconds ( 3 minutes 32.29 seconds)