

Comparison of GoogLeNet and Overfeat Classifiers
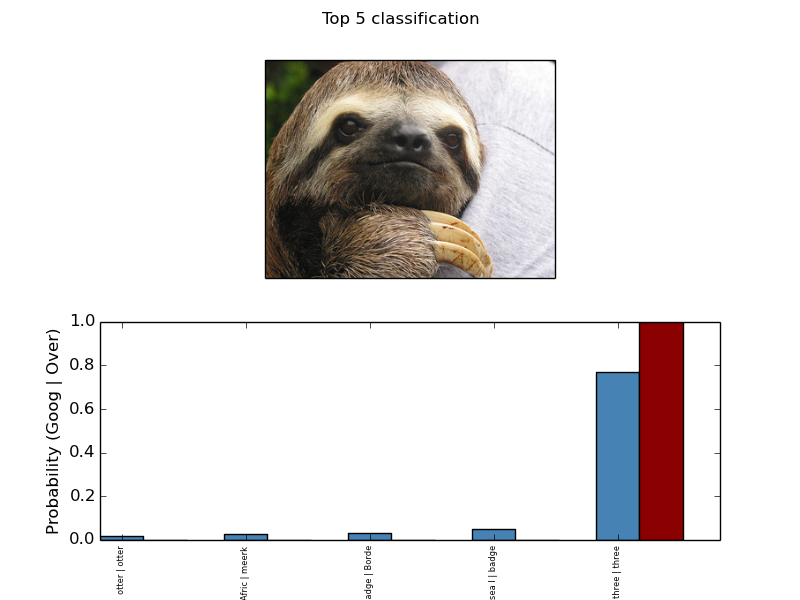
In this example, an image is input to an OverfeatClassifier and a GoogLeNetClassifier, and the top N probability outputs are compared for both classifiers.
Script output:
Overfeat predictions [['otter' 'meerkat, mierkat' 'Border terrier' 'badger'
  'three-toed sloth, ai, Bradypus tridactylus']]
Overfeat probabilities [[  2.14521634e-07   1.34061577e-06   7.87416593e-06   1.31268520e-04
    9.99858141e-01]]
GoogLeNet predictions [['otter' 'African grey, African gray, Psittacus erithacus' 'badger'
  'sea lion' 'three-toed sloth, ai, Bradypus tridactylus']]
GoogLeNet probabilities [[ 0.0191793   0.02727892  0.03366567  0.04920716  0.76793528]]
Python source code: plot_comparison.py
print(__doc__)
import matplotlib
matplotlib.rc('xtick', labelsize=6)
import numpy as np
import matplotlib.pyplot as plt
from sklearn_theano.feature_extraction import GoogLeNetClassifier
from sklearn_theano.feature_extraction import OverfeatClassifier
from sklearn_theano.datasets import load_sample_image

X = load_sample_image("sloth_closeup.jpg")
top_n_classes = 5
goog_clf = GoogLeNetClassifier(top_n=top_n_classes)
over_clf = OverfeatClassifier(top_n=top_n_classes)
goog_preds = goog_clf.predict(X)
over_preds = over_clf.predict(X)
goog_probs = goog_clf.predict_proba(X)
over_probs = over_clf.predict_proba(X)
f, axarr = plt.subplots(2, 1)
plt.suptitle("Top %i classification" % top_n_classes)
axarr[0].imshow(X)
axarr[0].autoscale(enable=False)
axarr[0].get_xaxis().set_ticks([])
axarr[0].get_yaxis().set_ticks([])
ind = np.arange(top_n_classes)
width = .35
axarr[1].bar(ind, goog_probs.ravel(), width, color='steelblue')
axarr[1].bar(ind + width, over_probs.ravel(), width, color='darkred')
# Just make the array, then we will fill it correctly
print("Overfeat predictions", over_preds)
print("Overfeat probabilities", over_probs)
print("GoogLeNet predictions", goog_preds)
print("GoogLeNet probabilities", goog_probs)
labels = goog_preds.ravel()
for n in range(len(labels.flat)):
    labels[n] = goog_preds.flat[n][:5] + " | " + over_preds.flat[n][:5]
axarr[1].set_xticks(ind + width / 2)
axarr[1].set_xticklabels(labels, rotation='vertical')
axarr[1].set_ylabel("Probability (Goog | Over)")
plt.show()
Total running time of the example: 139.50 seconds ( 2 minutes 19.50 seconds)