

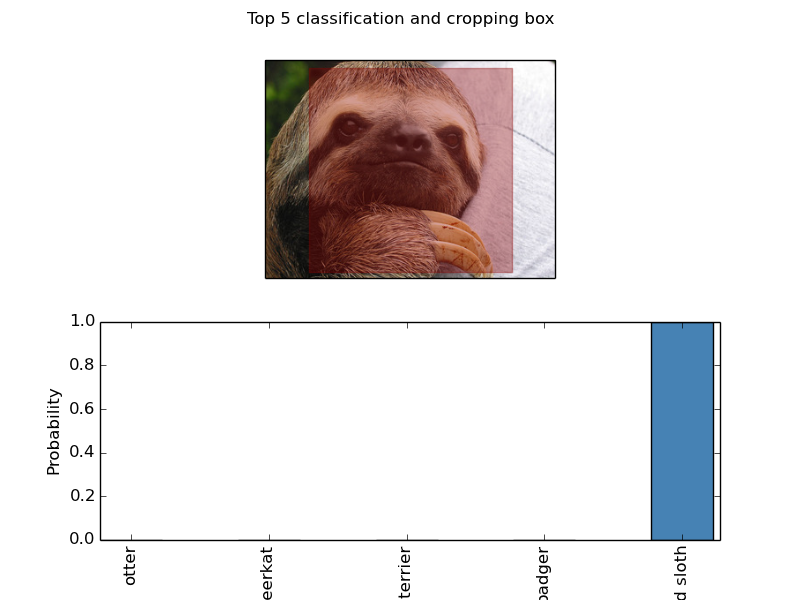
Classification and top N prediction probabilities
In this example, an image is input to an OverfeatClassifier, and the top N probability outputs are plotted as a bar graph. The red box represents the cropping window on the input - because input is forced to be 231x231, a center box of size 231x231 is taken from the larger image to perform classification.
In general, the top N probability outputs represent the most likely potential classes for the OverfeatClassifier.
Python source code: plot_classification.py
print(__doc__)
import numpy as np
import matplotlib.pyplot as plt
from matplotlib.patches import Rectangle
from sklearn_theano.datasets import load_sample_image
from sklearn_theano.feature_extraction import OverfeatClassifier

X = load_sample_image("sloth_closeup.jpg")
top_n_classes = 5
clf = OverfeatClassifier(top_n=top_n_classes)
prediction = clf.predict(X)
# Shortened the labels for plotting
prediction = [p.split(",")[0] for p in prediction.ravel()]
prediction_probs = clf.predict_proba(X)
crop_width = clf.crop_bounds_[1] - clf.crop_bounds_[0]
crop_height = clf.crop_bounds_[3] - clf.crop_bounds_[2]
crop_box = Rectangle((clf.crop_bounds_[0], clf.crop_bounds_[2]), crop_width, crop_height,
                     fc='darkred', ec='darkred', alpha=.35)
f, axarr = plt.subplots(2, 1)
plt.suptitle("Top %i classification and cropping box" % top_n_classes)
axarr[0].imshow(X)
axarr[0].add_patch(crop_box)
axarr[0].autoscale(enable=False)
axarr[0].get_xaxis().set_ticks([])
axarr[0].get_yaxis().set_ticks([])
ind = np.arange(top_n_classes)
width = .45
axarr[1].bar(ind, prediction_probs.ravel(), width, color='steelblue')
axarr[1].set_xticks(ind + width / 2)
axarr[1].set_xticklabels(prediction, rotation='vertical')
axarr[1].set_ylabel("Probability")
plt.show()
Total running time of the example: 19.20 seconds ( 0 minutes 19.20 seconds)